

The Top 8 Most Important Excel Skills for Finance
Walk through our top 8 Excel skills for finance, featuring common formulas and functions used by business, finance, and investment professionals.

The Top 8 Most Important Excel Skills for Finance
Excel skills are in high demand in today's highly competitive job landscape, and mastering them can make you a valuable asset in any corporate role. Whether you're a complete beginner or an advanced user, this article will outline the must-have Excel skills for business professionals, including key formulas, functions, and shortcuts used in investment banking, management consulting, business operations, product marketing, and other corporate office roles.
Our Top 8 Essential Excel Formulas and Functions:
- Beginner: Spreadsheet Formatting
- Beginner: Excel Aggregation Functions
- Beginner: Charting & Data Visualization
- Intermediate: Finance Formulas (NPV, IRR, PMT, XNPV … etc.)
- Intermediate: Lookup Formulas (VLOOKUP, XLOOKUP, INDEX MATCH)
- Advanced: Pivot Tables
- Advanced: What if Analysis
- Advanced: VBA & Macros
Essential Excel Skills for Beginners
If you are new to Excel, it can be overwhelming to learn all the features at once, but there are some essential skills that will set you apart and broaden your career opportunities. If you are looking for a job in business or finance, you must understand some of Excel’s basic features in order to advance in your career. Essential skills such as formatting spreadsheets or being familiar with basic functions and formulas will build the foundation needed for you to become a proficient Excel user.
#1 Spreadsheet Formatting
When working with financial data in Excel, it is critical to have the right numbers in the correct cells. But formatting, which means customizing the appearance of your spreadsheet to make it more appealing to relevant stakeholders, is pretty important too. The use of formatting techniques will allow you to better organize data and provide context and consistency when preparing financial reports.
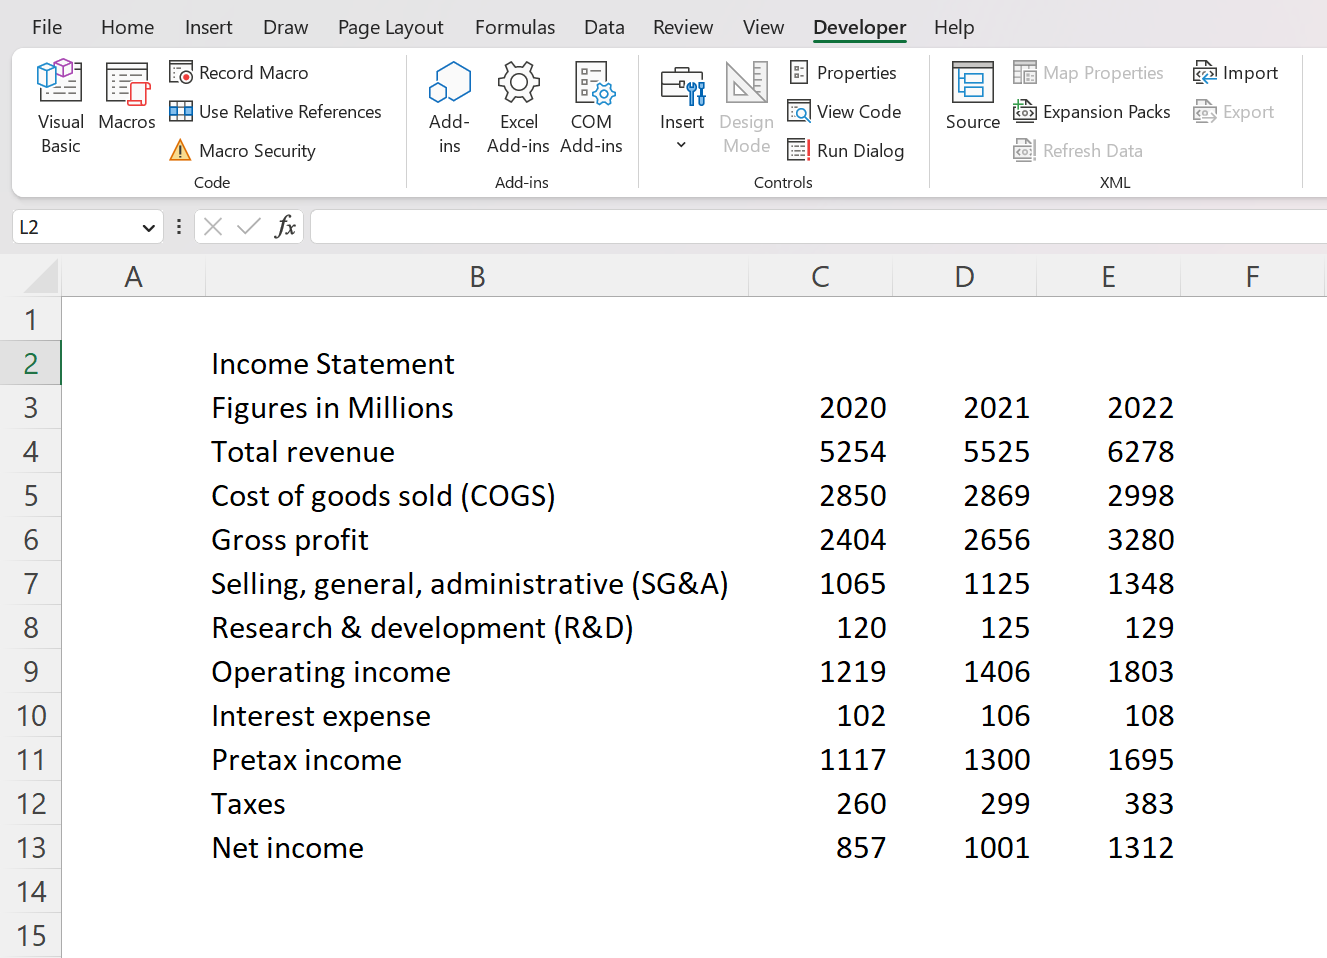
Example: Colors, Borders, & Cell Size
Any beginner Excel user should learn how to change the color, border, cell size, and other formatting options on a spreadsheet. Let’s look at the simple example below that makes use of some essential formatting options.
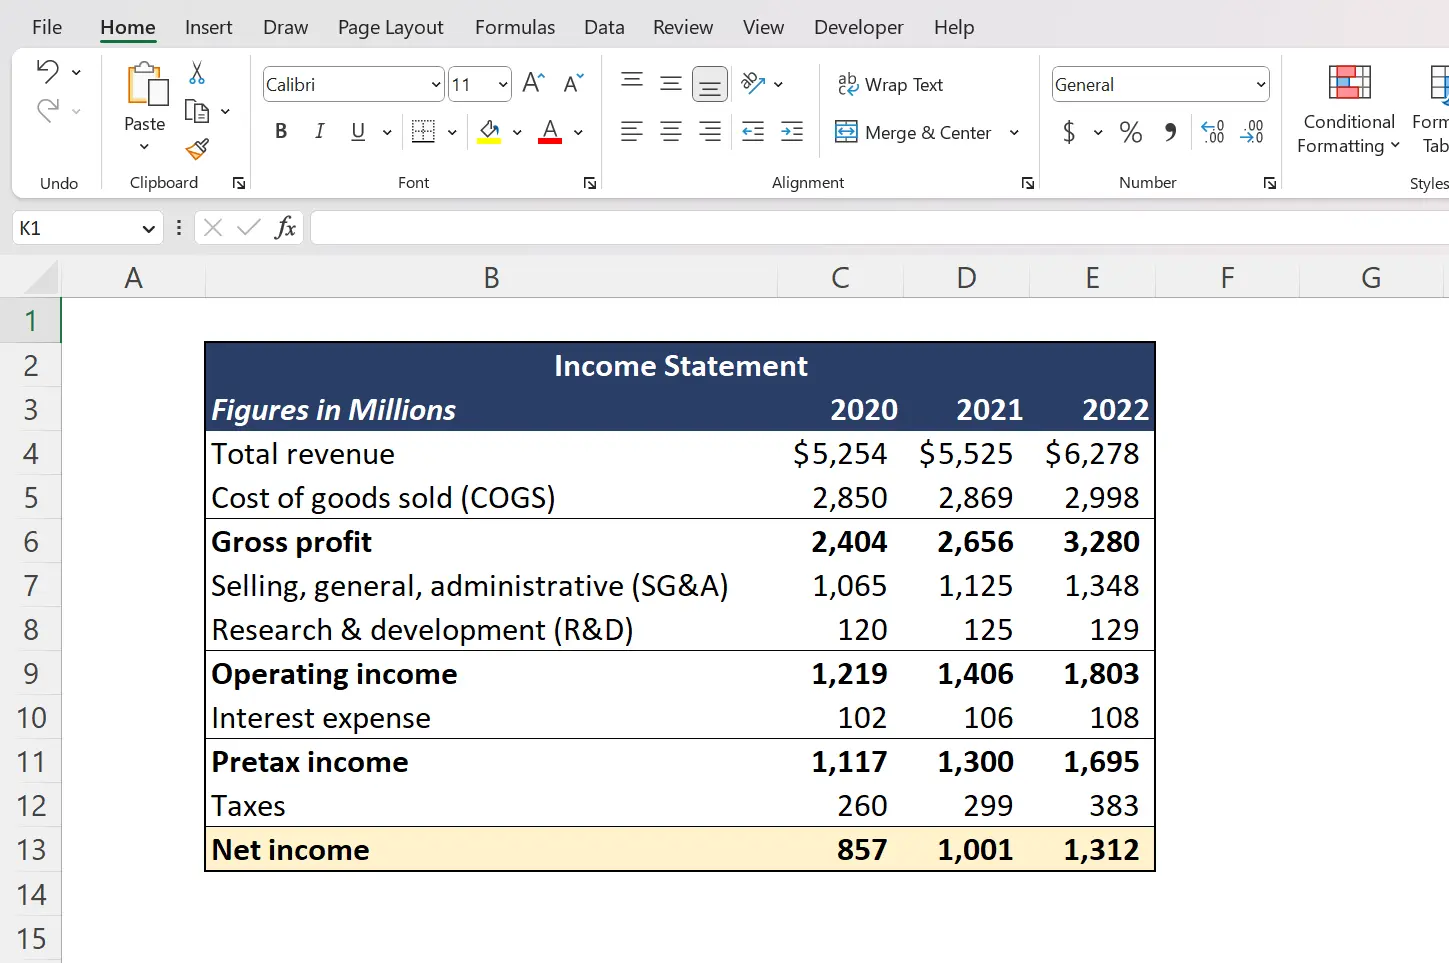
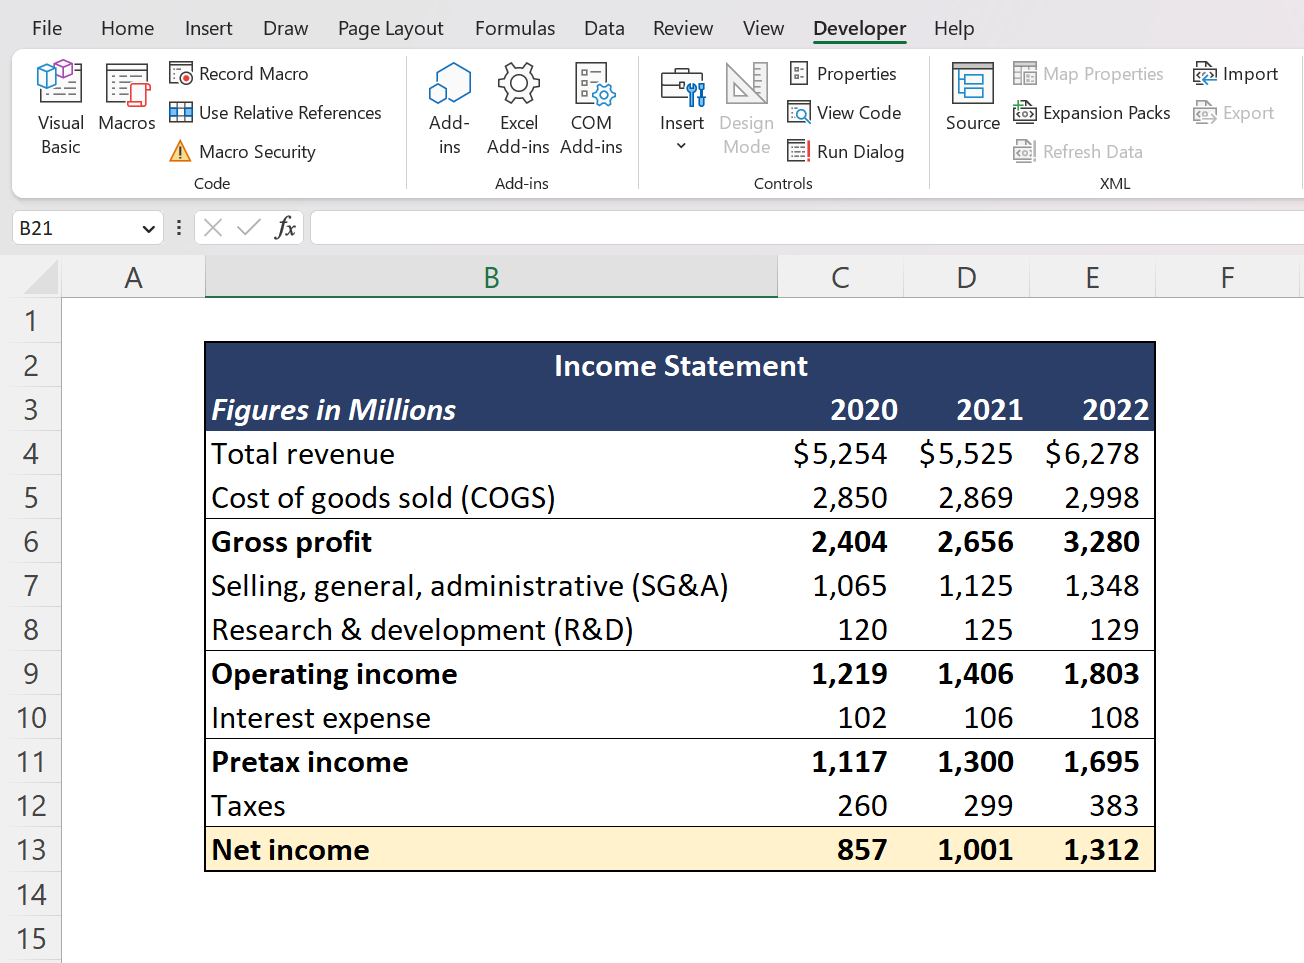
Key Formatting Notes:
- Gridlines have been switched off to create a plain white background in the spreadsheet. This makes the text and figures easier to read.
- Borders have been applied to key line items (operating income, pretax income, and net income). A border has also been placed around the entire outer table to better contain the income statement.
- Cell fill color has been changed to light yellow for the last row of cells to further highlight the important net income figures. Cell labels at the top have also been changed to a dark blue fill to differentiate the header labels from the rest of the income statement.
- Font color of the header labels has been changed to white to make the text easier to read against the dark blue background.
- Italics format has been applied to the “Figures in Millions” to show users that this is a note for the income statement table.
- Bold formats have been applied to the header text and key line items (Gross profit, operating income, pretax income, and net income) for further emphasis.
- Cell format has been changed for number figures. The top row uses the Accounting cell format to show that figures are displayed as US currency. All other figures contain a thousand comma separator to make it easier to read numbers longer than 3 digits.
Example: Conditional Formatting
Being able to understand the use of color coding in spreadsheets can make data work for those around you. This is especially useful in financial modeling and business reporting where analysts strive to keep visual elements clean and easy to understand. After all, consistency, efficiency, and clarity are essential factors in a well-designed spreadsheet, and creating a consistent color indicator can help convey this to all of your readers.
Let’s look at the following example where conditional formatting has been applied to an employee sales data table.
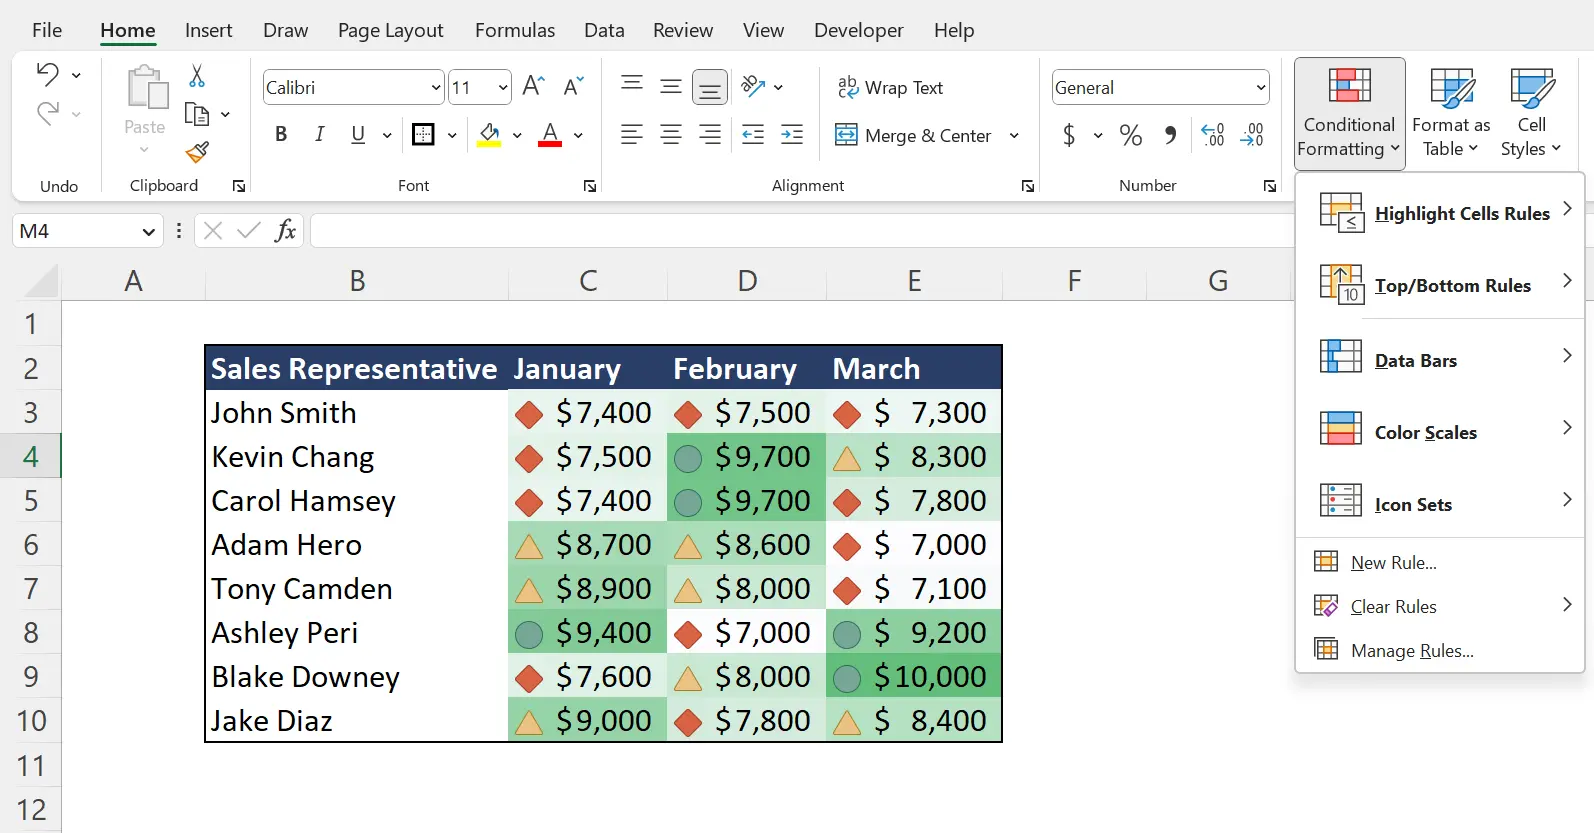
Key Formatting Notes:
- Icon sets have been applied to help viewers quickly mark low-level sales (red diamond), middle-level sales (yellow triangle), and high-level sales (green circle).
- Color scales have been applied via the dark green color scale to emphasize high sales figures. Higher sales figures are marked in darker shades of green.
#2 Excel Aggregation Functions
The use of pre-built formulas is essential for performing basic calculations and analysis. Business and finance professionals must be able to understand these basic aggregation functions in order to build more complex financial models.
Let’s quickly explore aggregation functions with this example product sales data table.
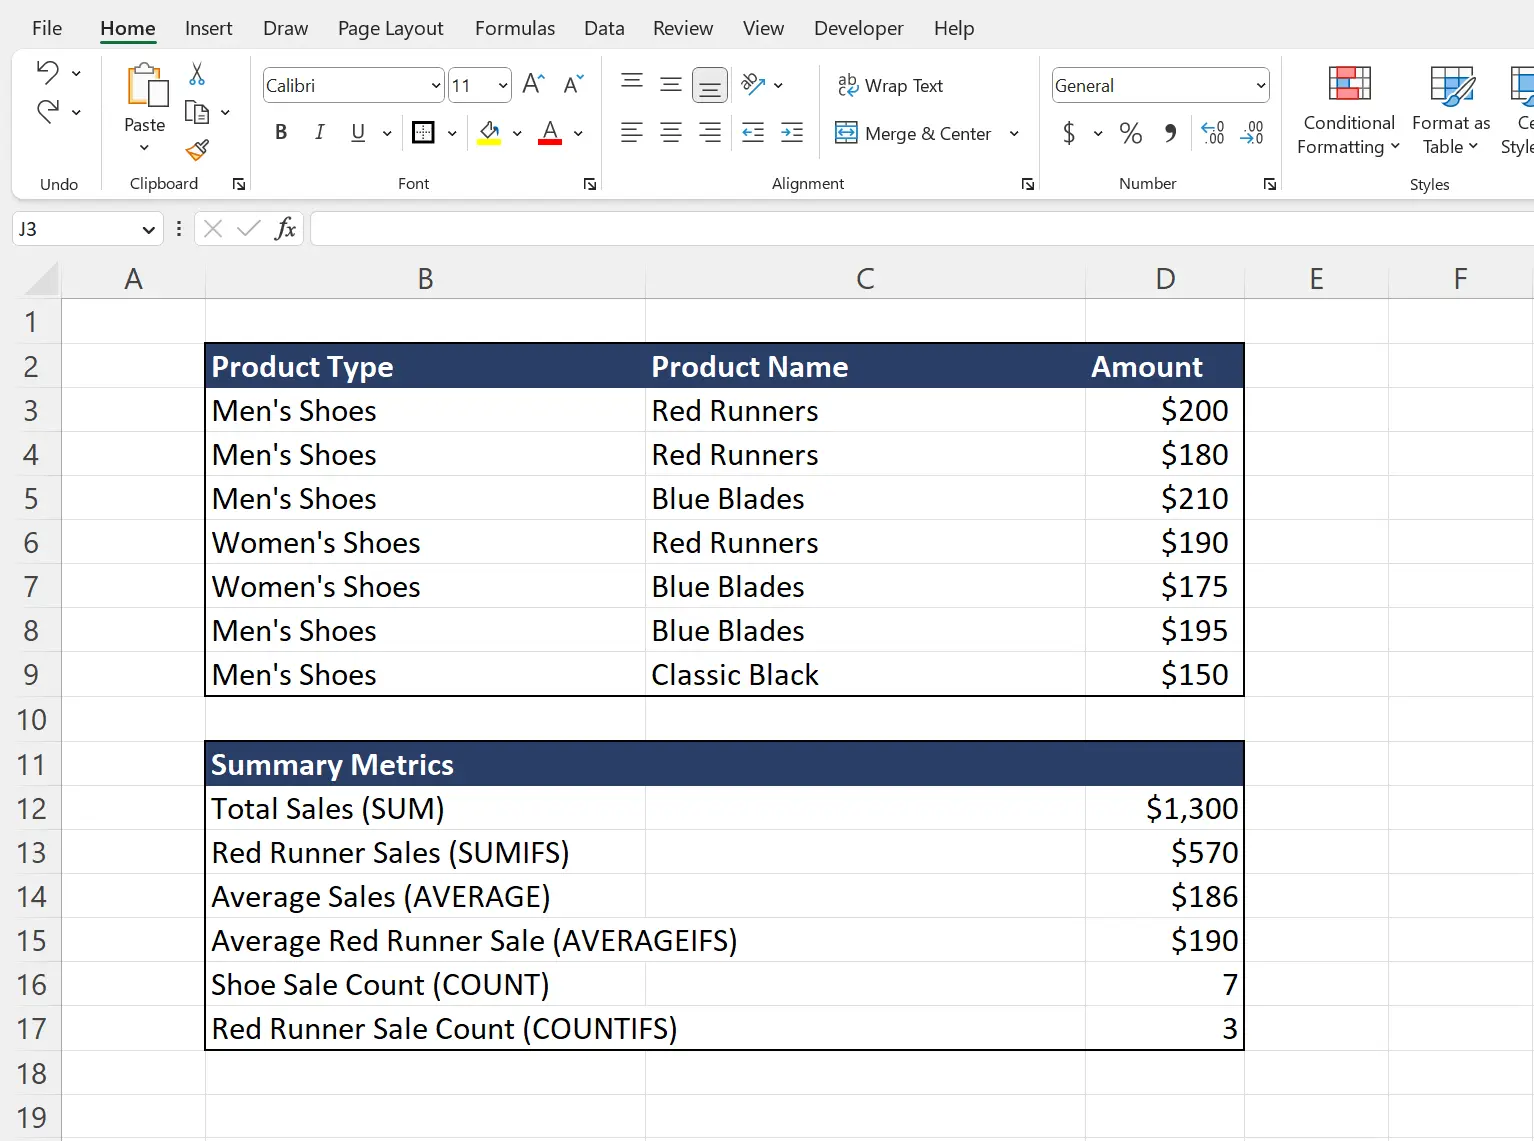
Formula Notes:
- SUM function has been used to add all sale amounts.
- SUMIFS function has been used to add up only “Red Runner” sales.
- AVERAGE function has been used to find the average of all sales.
- AVERAGEIFS function has been used to find the average of all “Red Runner” sales.
- COUNT function has been used to count the total number of transactions.
- COUNTIFS function has been used to count the number of “Red Runner” transactions.
In this particular example, you can see how the user makes general aggregations (sum, average, and count) alongside conditional aggregations that only perform the aggregation function on items that meet the specific criteria (Ex. Red Runner Shoes).
These aggregation formulas will be frequently used to perform calculations across multiple cells. Advanced users will often nest multiple formulas within each other to create more complex spreadsheet operations.
#3 Charting and Data Visualization
Excel is a great tool for visualizing data. Once you are familiar with some basic functions and formulas, you should consider exploring Excel’s charting features which can help you build the charts you need to assemble dashboards and presentation visuals.
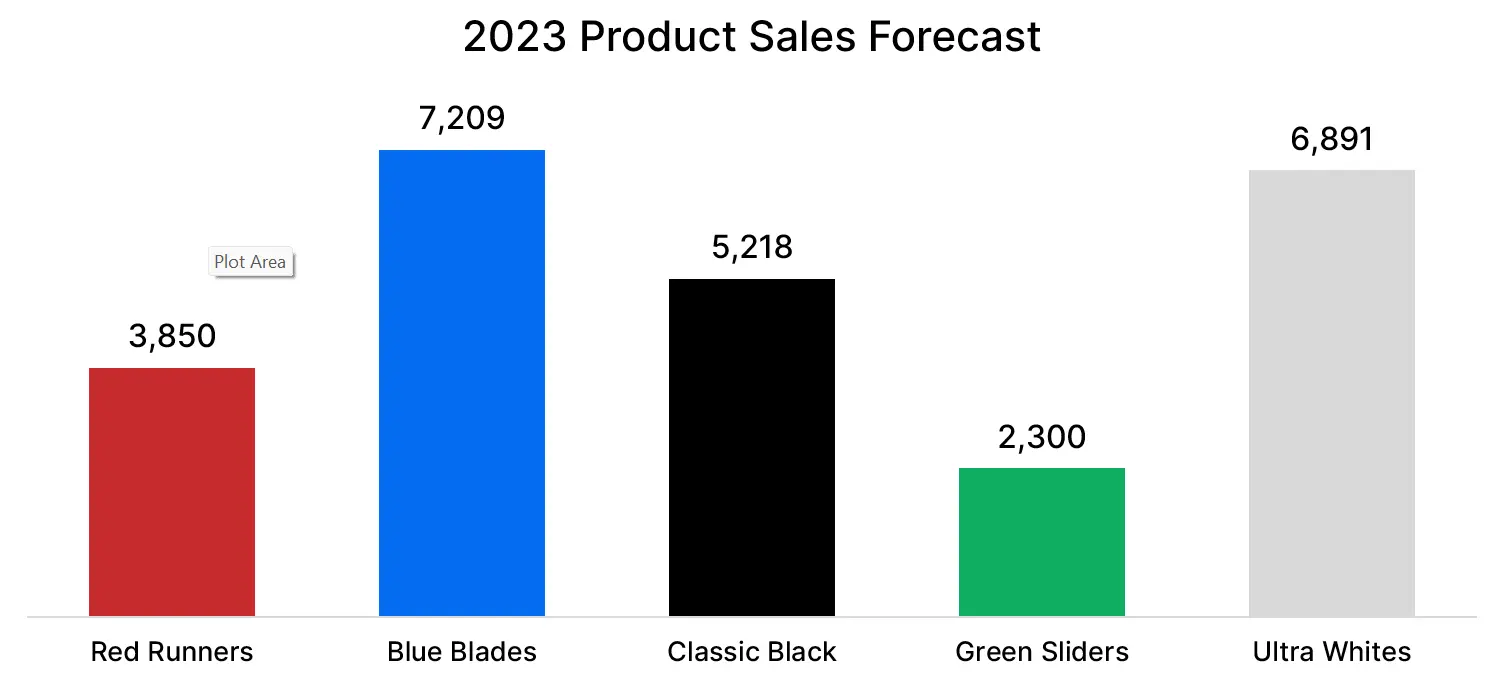
Example: Column Chart
Column charts are great for showing comparisons between item categories or changes over a period of time (although some argue line charts are better for time-oriented data).
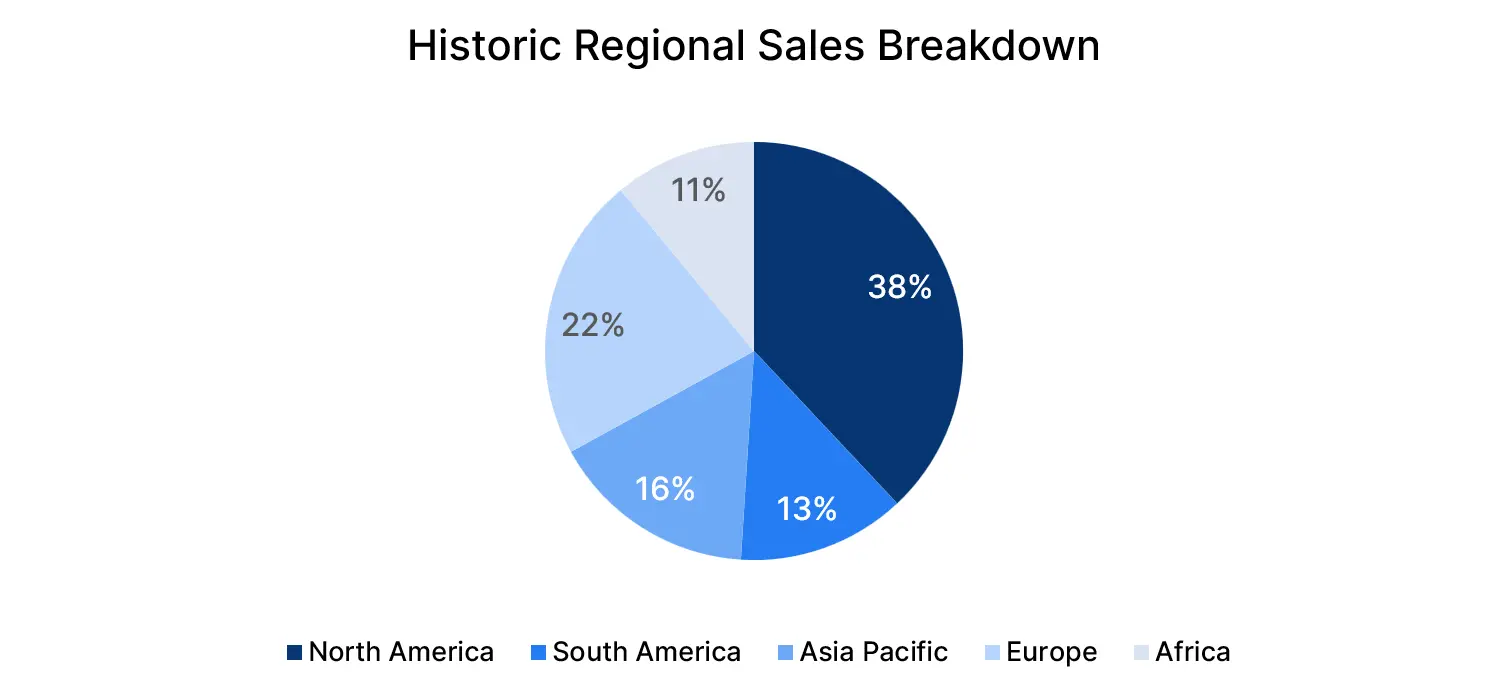
Example: Pie Chart
Pie charts are great for displaying proportions or percentage breakdowns of a total. The example below uses a pie chart to break down total company revenue by geographic market.
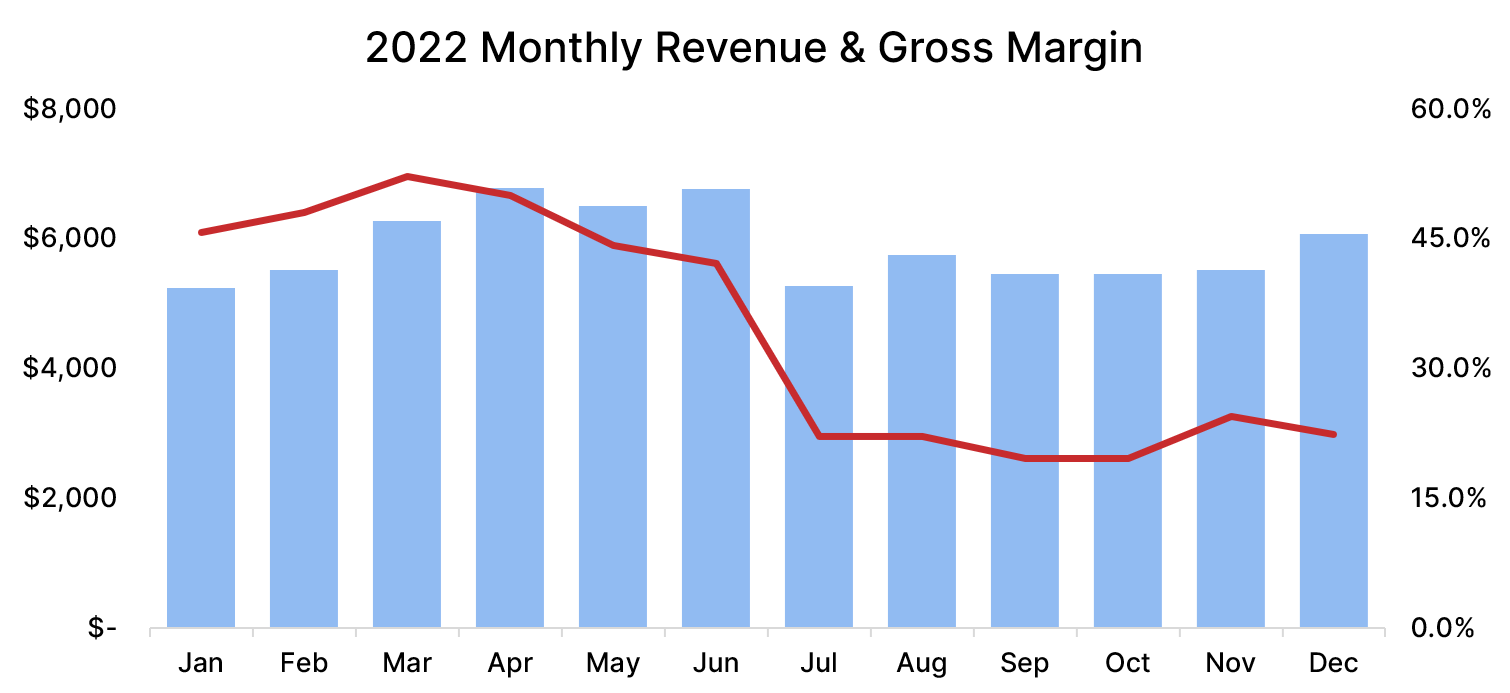
Example: Combo Chart
Combo charts are great for showing multiple pieces of related information in one graphic. In business and finance, revenue and gross margin are often paired together and displayed in a combo column-line chart as seen in the example below.
#4 Standard Finance Formulas
Investment bankers, financial analysts, and investment research professionals rely heavily on Microsoft Excel and its built-in financial formulas. These financial formulas help make important calculations that support asset valuations, financial reporting, and investment decision-making.
Here are three commonly used Excel finance functions:
- Net Present Value (NPV): Calculates the net present value of a series of cash flows. Often used by businesses to evaluate the scale and profitability of different projects.
- Internal Rate of Return (IRR): Calculates the rate of return on a series of project cash flows. Often used by businesses to compare potential investment projects and their projected returns.
- Payments Function (PMT): Calculates the periodic payments on a loan assuming constant payments and a constant interest rate.
The example below showcases how an analyst can use the NPV and IRR functions to evaluate and compare two different investment projects. These formulas simply make use of the projected net cash flows and the input discount rate to calculate NPV and IRR.
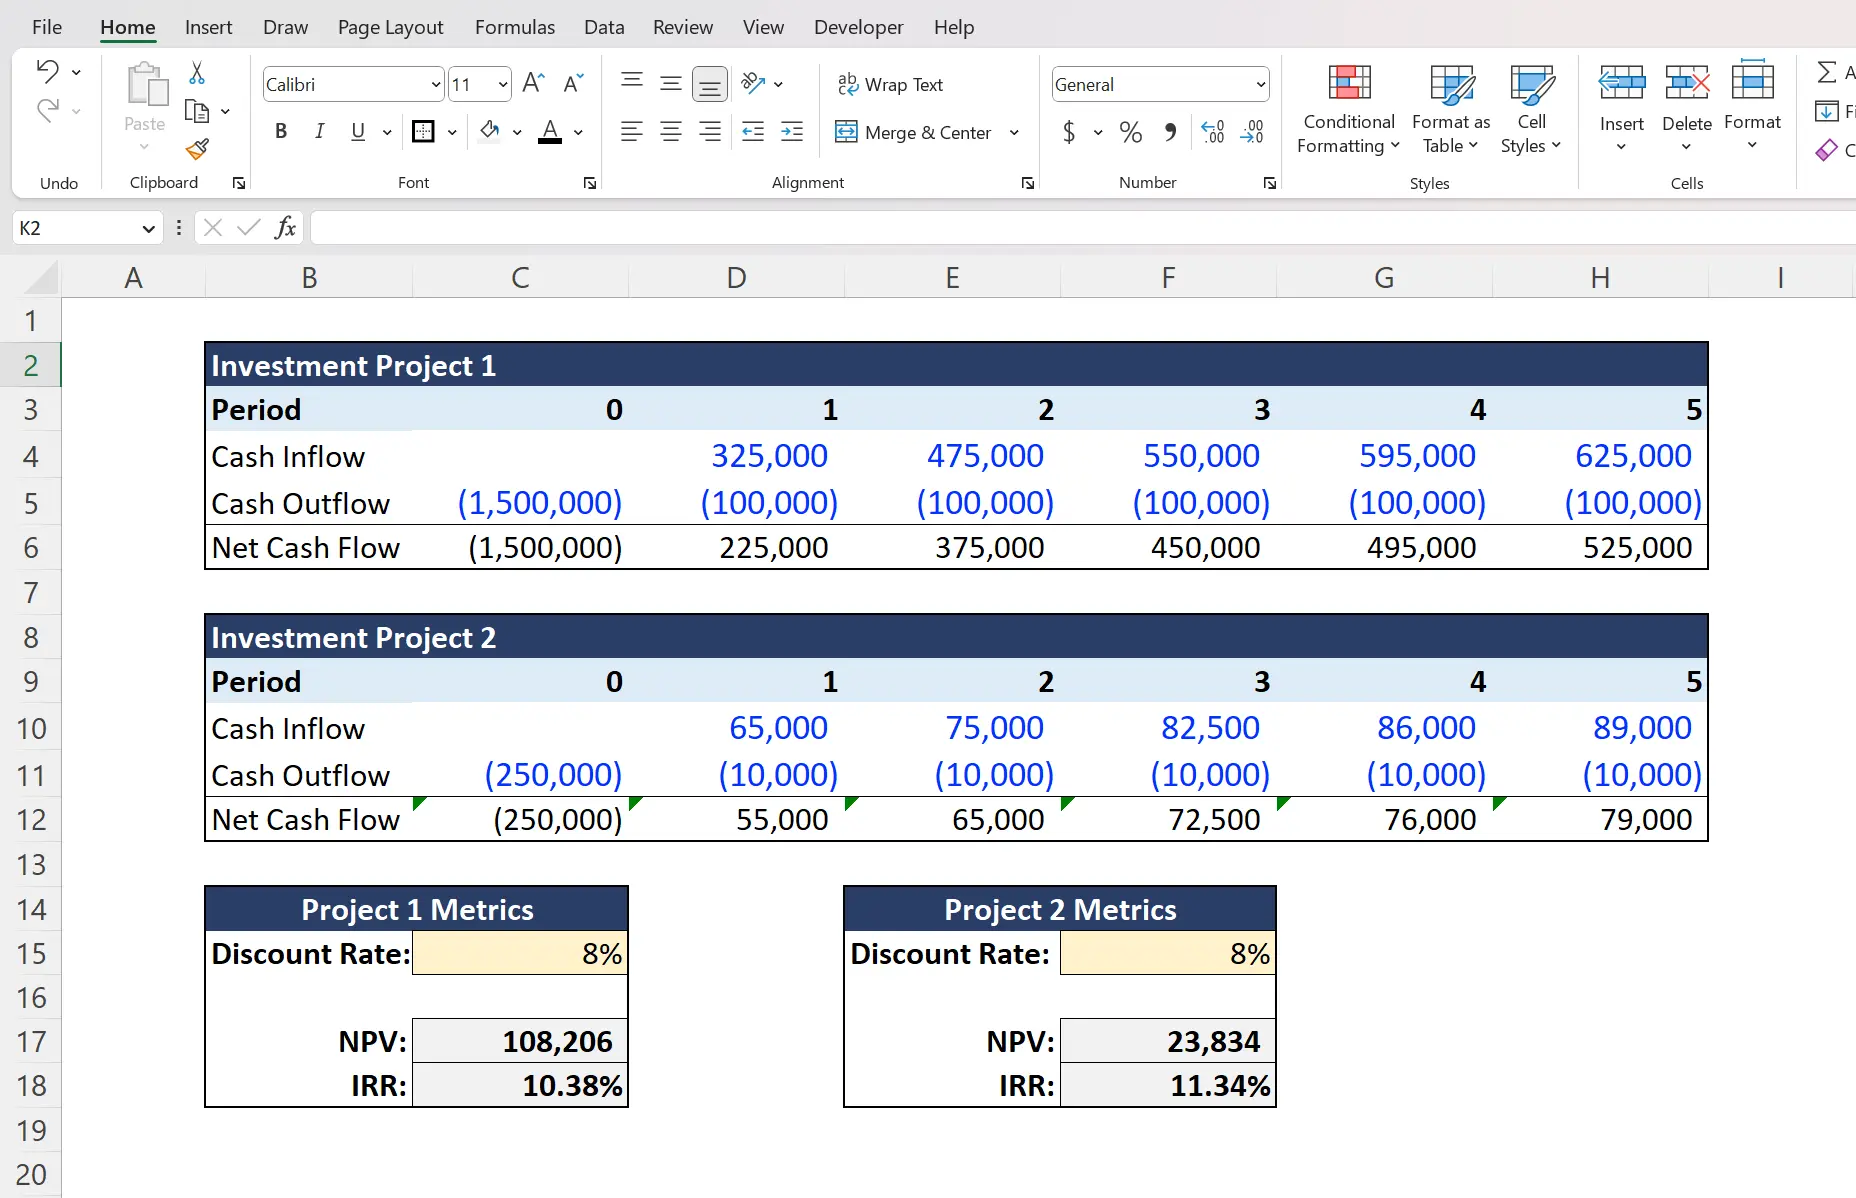
Ideally, analysts select the project with the highest NPV and highest IRR. However, this example would require the analyst to choose between a project with higher total profits (NPV) or higher return per dollar invested (IRR).
Excel offers more than 50 built-in financial functions that can help analysts make quick financial calculations needed to support important investment decisions.
#5 Lookup Formulas (VLOOKUP, XLOOKUP, INDEX MATCH)
Lookup formulas are essential formulas used by business and finance analysts to quickly search and find results from a table or collection of data. This functionality makes these formulas useful for building interactive dashboards that can pull select results from a backend dataset.
Key Lookup Formulas:
- VLOOKUP: Allows users to search for a specific cell in the table by finding a matching row item.
- HLOOKUP: Similar to VLOOKUP but use a horizontal search across a table (as opposed to a vertical scan).
- XLOOKUP: The upgraded, more flexible version of VLOOKUP. Microsoft’s XLOOKUP solves VLOOKUP’s issue of not being able to return values to the left of the matching column.
- INDEX: Used to get the value of a cell in a given table by specifying the number position of the row, column, or both.
- MATCH: Used to find the row or column position of a cell that matches the input value in the formula.
Note: The INDEX and MATCH functions are often paired together to form what’s known as a classic “INDEX MATCH” formula. The combination of INDEX and MATCH provides a slightly more flexible setup that allows the user to search a table with multiple row and/or column criteria.
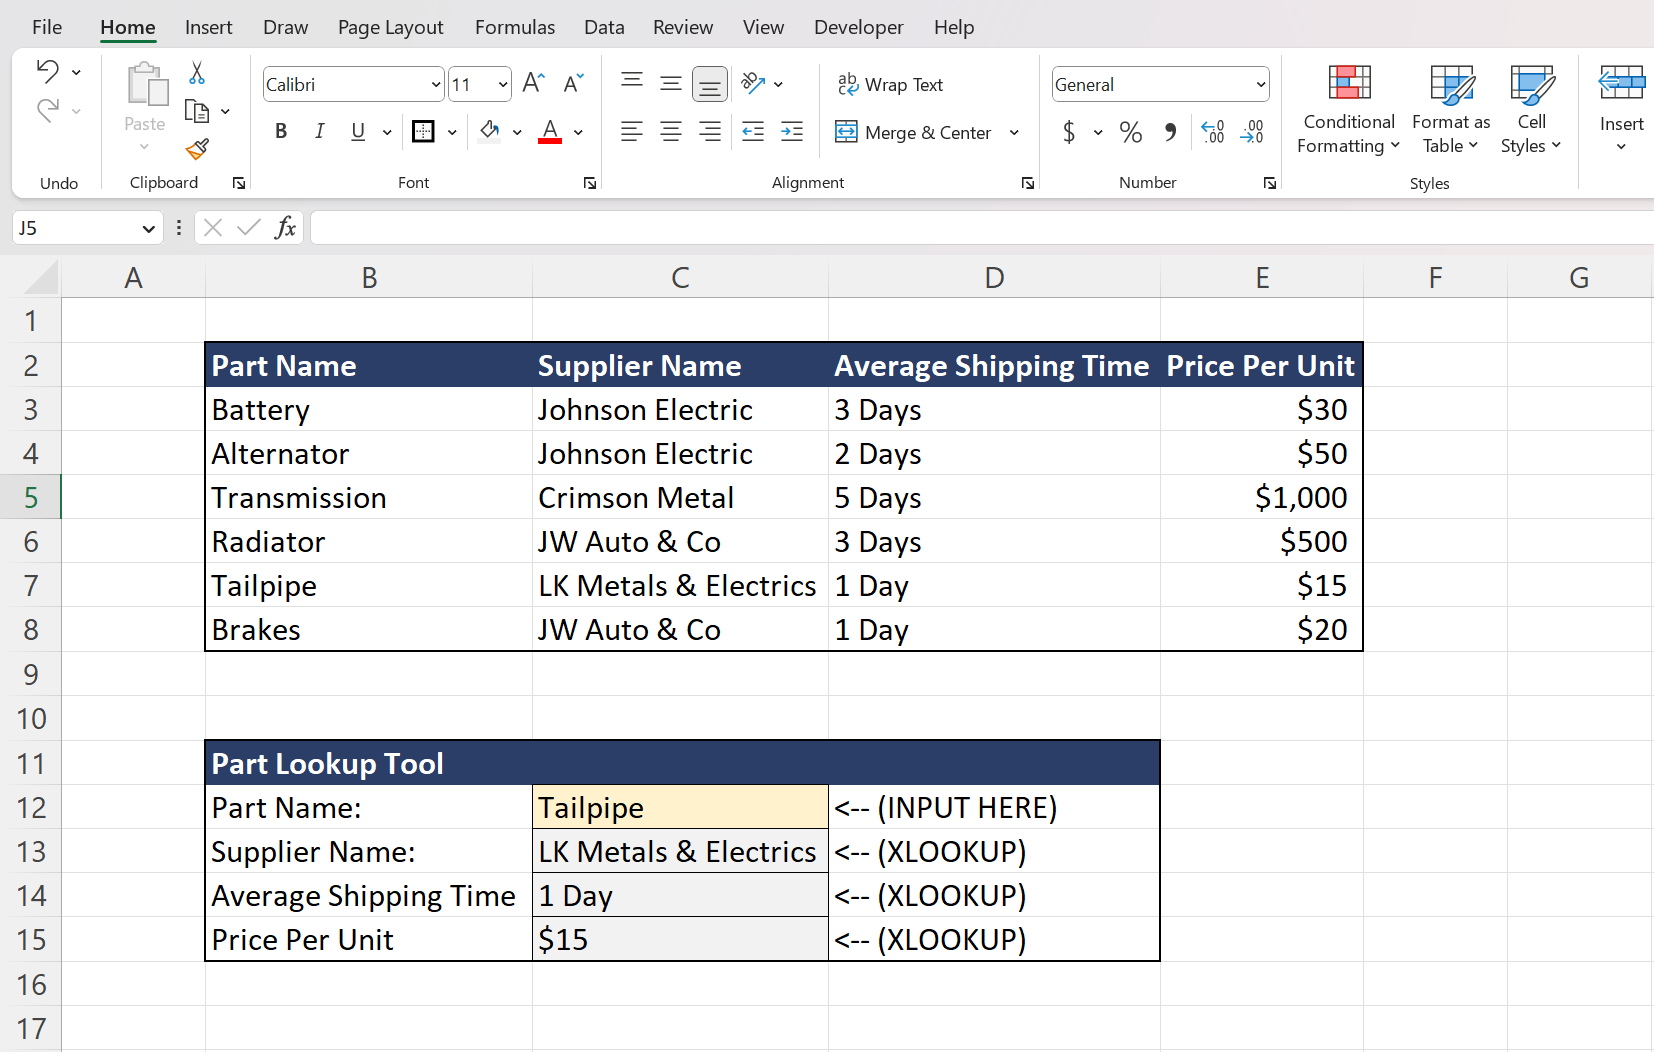
The example below uses XLOOKUP formulas to find the corresponding details for a given car part search.
In this particular example, the user has input a search for a car “Tailpipe” where the following XLOOKUP formulas pulled the supplier name, average shipping time, and price per unit from the above data table.
Need to learn how to use lookup formulas and other fundamental Excel tools?
Consider checking out our comprehensive Excel for Business & Finance Course where we teach students the Excel best practices used at Fortune 500 companies across the globe. Use this course to learn from industry professionals with former experience at Goldman Sachs, Tesla, Amazon, and other top-tier companies!
Advanced Excel Skills
Once you've mastered the basics, you can move on to more advanced Excel skills used by business and finance professionals. This includes a myriad of excel functions and tools that will enable you to quickly and effectively perform key tasks in any corporate job.
#6 Pivot Tables
Pivot tables are a powerful tool for analyzing and summarizing large datasets in a dynamic way. For example, they allow you to summarize data by key categories, such as sales, region, or product; they also enable you to filter and sort data based on specific information and create calculated fields to perform custom calculations. These features make Pivot tables one of Excel’s most powerful data analysis tools, used extensively by business financial analysts.
Let’s walk through a quick example of how pivot tables can be useful for finding quick patterns, trends, or insights. The image below represents a simple shoe sales data set that contains key details like the order date, location, product type, quantity, and revenue.
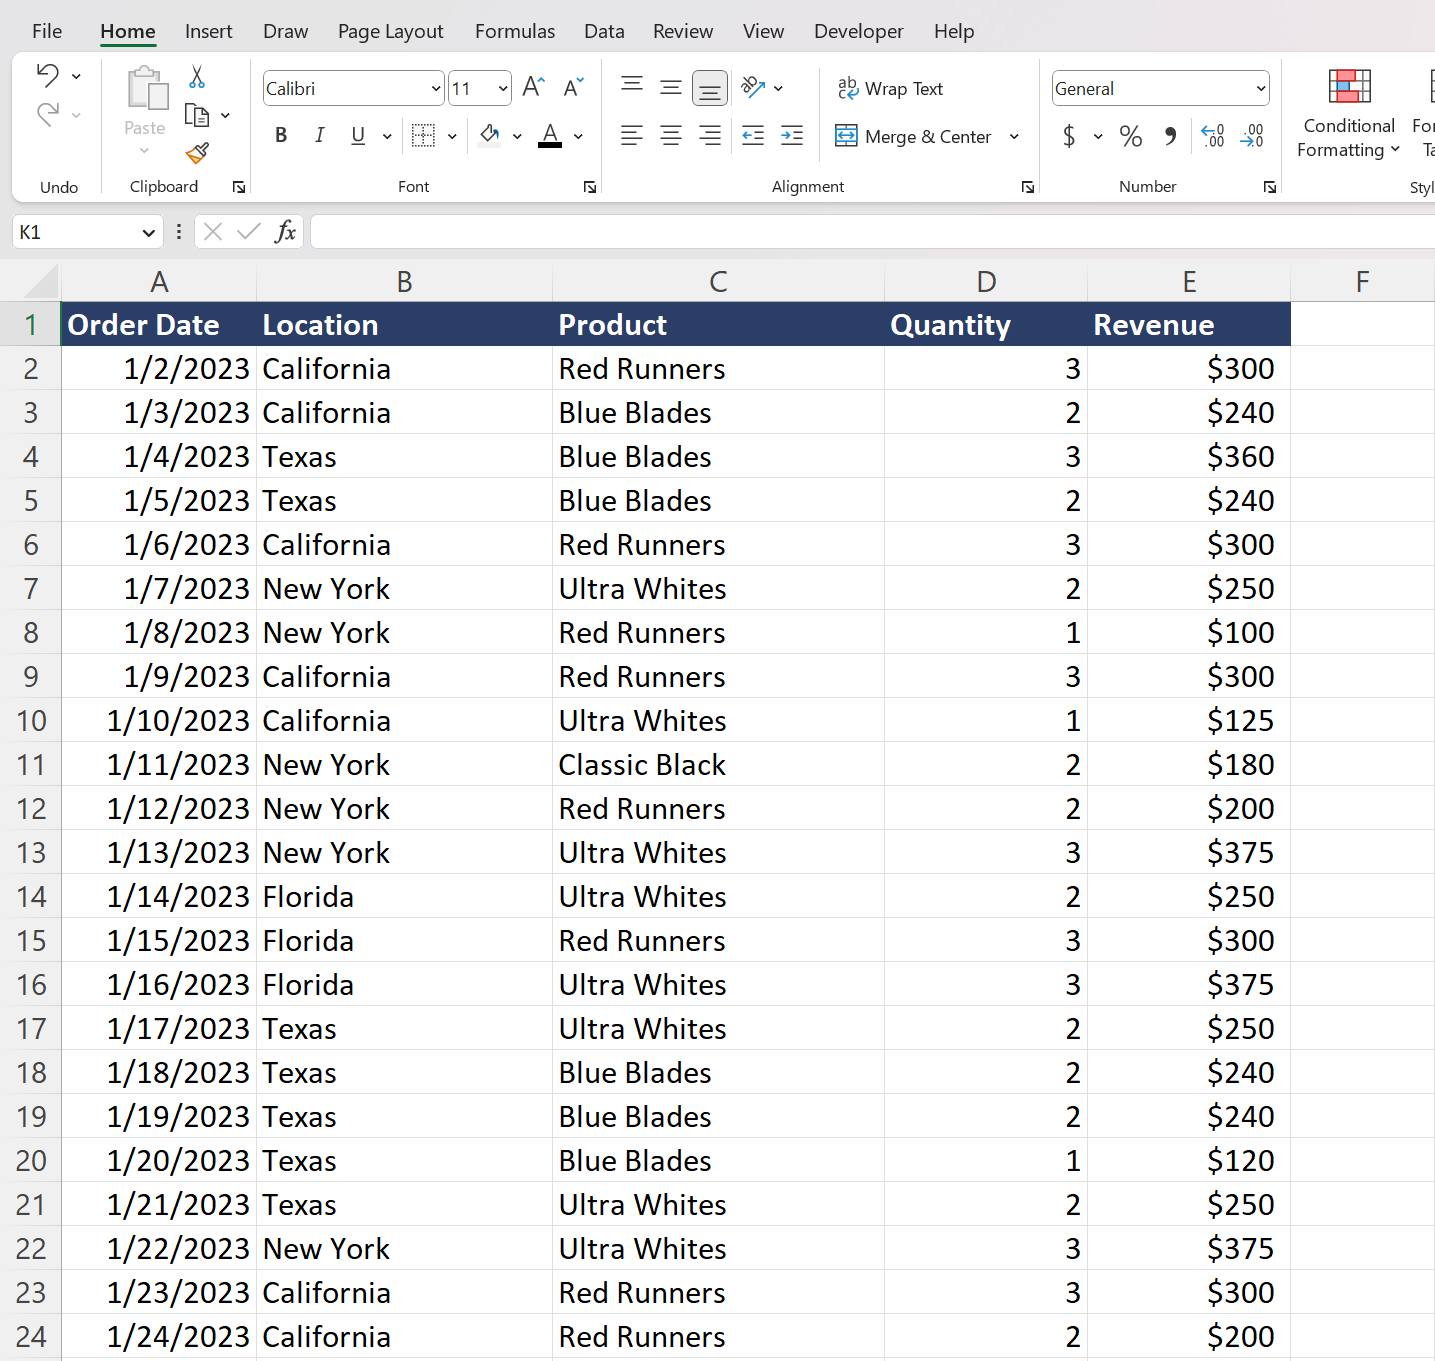
If we throw this into a quick pivot table (Values: Revenue, Rows: Location, Columns: Product) we can see how the large data set can be condensed into this easy-to-read table. From here, we can quickly see our highest revenue product (Ultra Whites) and our best-performing location (Florida).
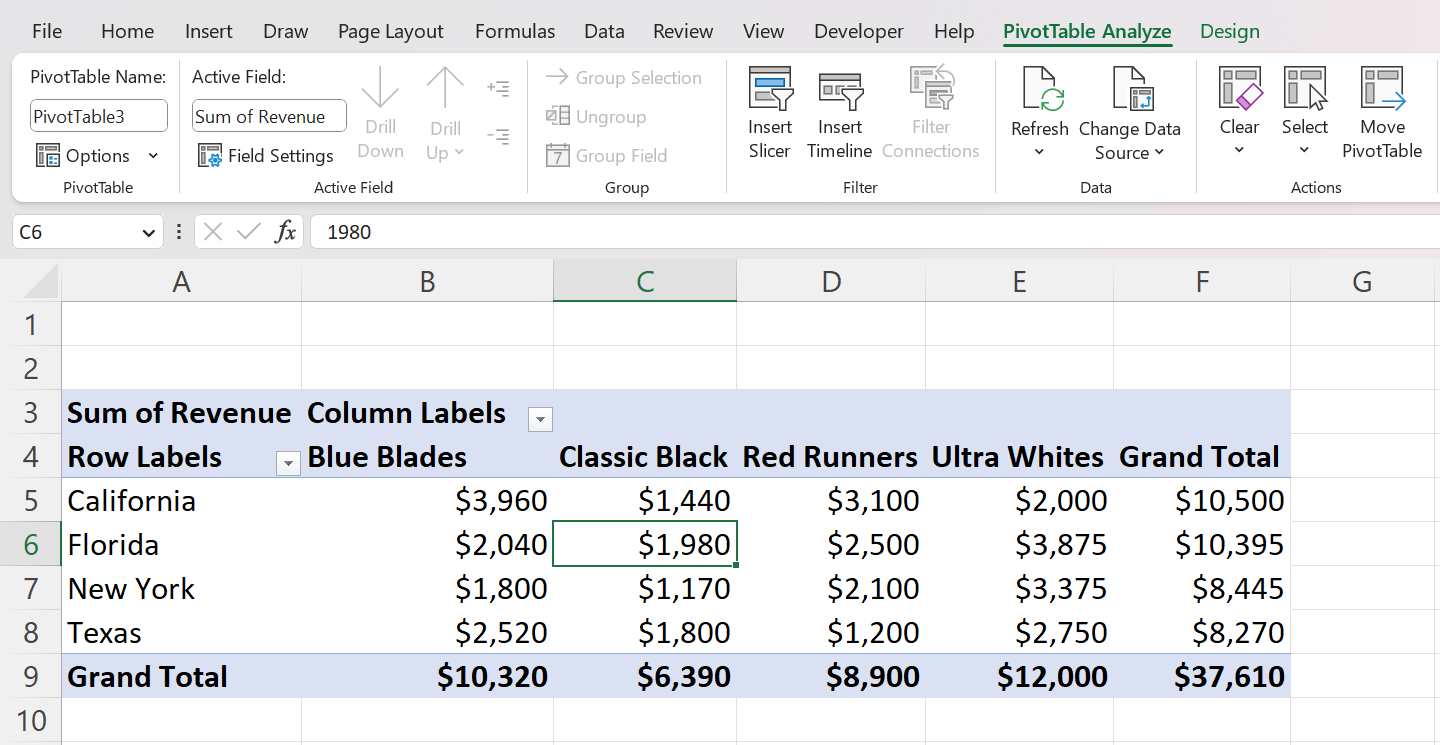
Simple pivot tables can be made in a few minutes. With this in mind, you’ll start to imagine how powerful this tool can be when applied to large sets of finance or accounting data.
#7 What-If Analysis
The What-If Analysis tool on Excel can be extremely helpful when you are trying to test the results of multiple scenarios with changes in your spreadsheet input variables.
Key What If Analysis Tools:
- Goal Seek: Excel uses a trial and error approach to back-solve for the input figures needed to create a target output.
- Data Tables: Excel calculates and displays the end output when changing 1 to 2 variables.
- Scenario Manager: Excel calculates and manages the end output when given different variables in different scenarios.
The example below features an income statement supported by inputs like the units sold, price per unit, cost per unit, etc.
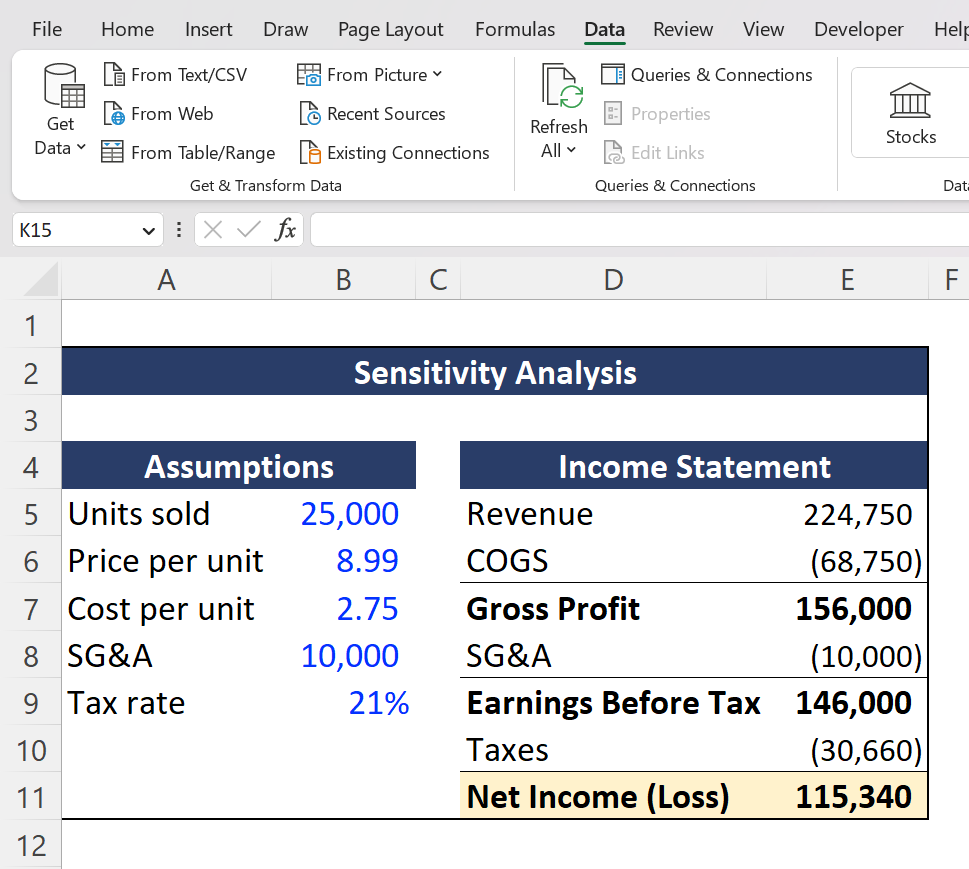
Business and finance analysts will commonly evaluate business forecasts and performance projections by looking at different business scenarios (Ex. raising prices or increasing the number of units sold). Instead of manually calculating the results by slightly adjusting the inputs, experienced analysts will use the What-If Analysis Data Table function in Excel.
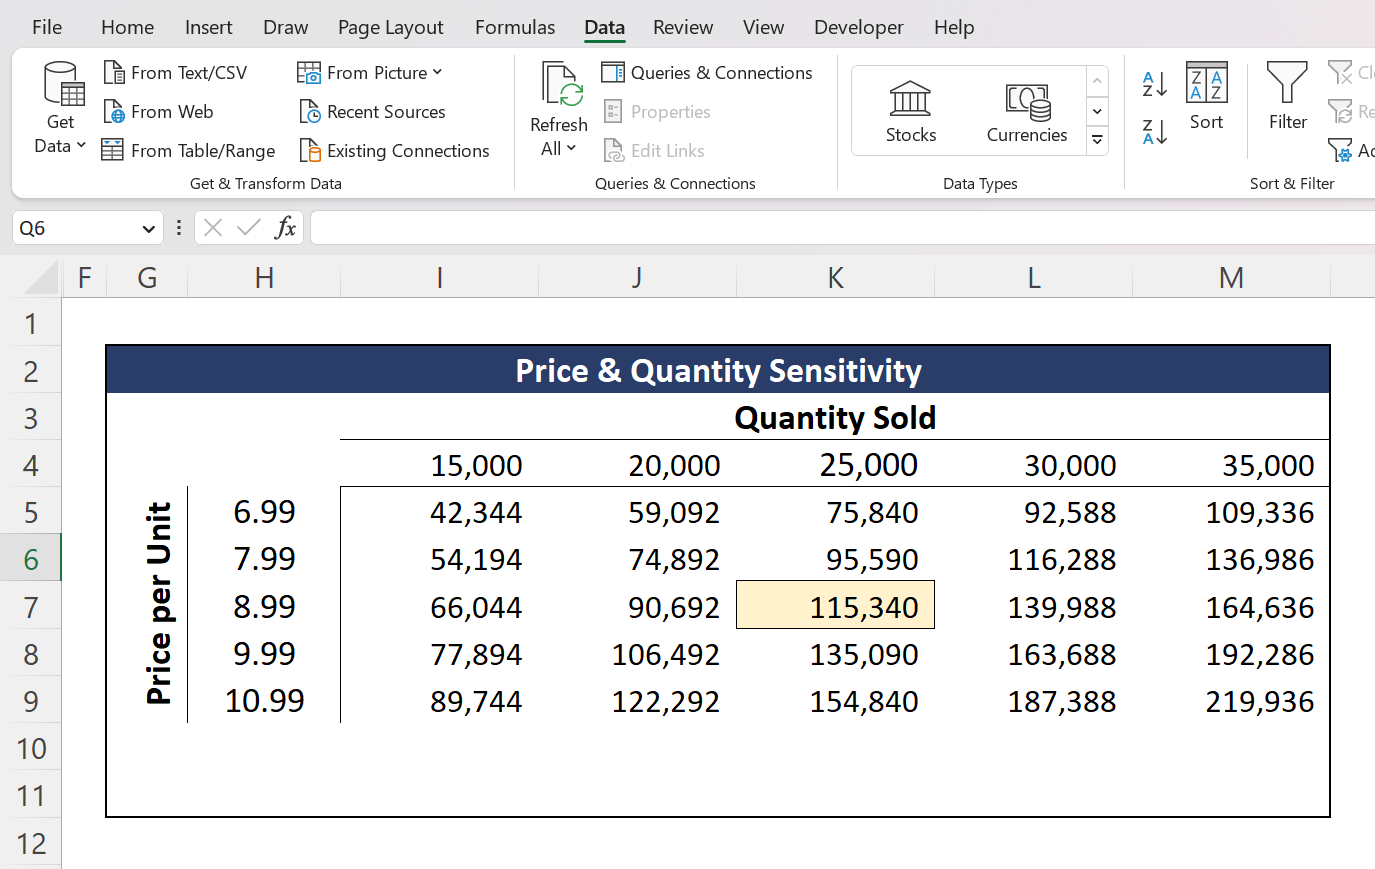
By using the Data Table tool, the analyst can quickly look at the changes in Net Income across changes in two variables (in this case: price per unit and quantity sold).
As you can imagine, mastery of these types of data calculation Excel tools will make you an extremely efficient and effective financial analyst.
#8 Automation, Macros and VBA
Advanced Excel users can take advantage of macros and VBA (Visual Basic for Applications) to automate repetitive tasks and make custom functions in Excel. This is especially useful for financial analysts who often reuse similar financial models and data visualization work in their day-to-day tasks.
Macros
Macros are a set of user-defined commands that are saved to be executed automatically when doing specific tasks.
Let’s say, for example, every month you are given updated figures for the company’s income statement revenue and expenses (in raw data format).
Here, you could consider saving a macro that would allow you to record your formatting steps. This way, you only have to go through all the formatting steps once, then every time you receive this updated raw data in the future, you can apply the same formatting in a matter of seconds with the simple click of your saved macro button.
VBA
Visual Basic for Applications (VBA) is a powerful, simple programming language created by Microsoft to extend and automate the capabilities of Excel and other Office software.
With VBA, you can automate any task you can perform in Excel, and save the resulting code as a macro that can be used repeatedly. This can significantly increase efficiency and output, especially for repetitive tasks or when cleaning data across multiple spreadsheets. You can also use VBA to interact with other programs and databases.
Get the Most out of Excel
If you're interested in further developing your Excel skills to better your chances at landing a competitive finance or investment role, check out our Excel for Business & Finance Course and our Complete Finance & Valuation Course to join our students who have landed jobs at Goldman Sachs, Bloomberg, EY, and other top tier companies.
Other Articles You May Find Helpful
FAQs
Question: How long does it take to learn Excel?
The amount of time it takes to learn Excel depends on how much time you devote to learning and practicing. With regular practice, you can learn the basics in a few days or weeks. If you get started with our Excel for Business and Finance course, you can complete it at your own pace with unlimited access to the course training materials.
Question: How can I improve my Excel skills for finance?
To improve your Excel skills for finance, consider watching Excel tutorials, practicing with sample datasets, and taking online courses such as our Excel for Business & Finance Course and Complete Finance & Valuation Course. Start with the very basics of learning how to format data, create formulas and apply functions, and practice on a daily basis.
Question: What are some common mistakes to avoid when using Excel for finance?
Common mistakes to avoid when using Excel for finance include using too many hardcoded numbers, failing to format financial statements correctly, and relying too heavily on manual processes that can be automated.


Ready to Level Up Your Career?
Learn the practical skills used at Fortune 500 companies across the globe.