
Power BI for Business Analytics
Master Power BI, the leading business intelligence tool to transform, analyze and visualize data.


Taught by Instructors with Experience At


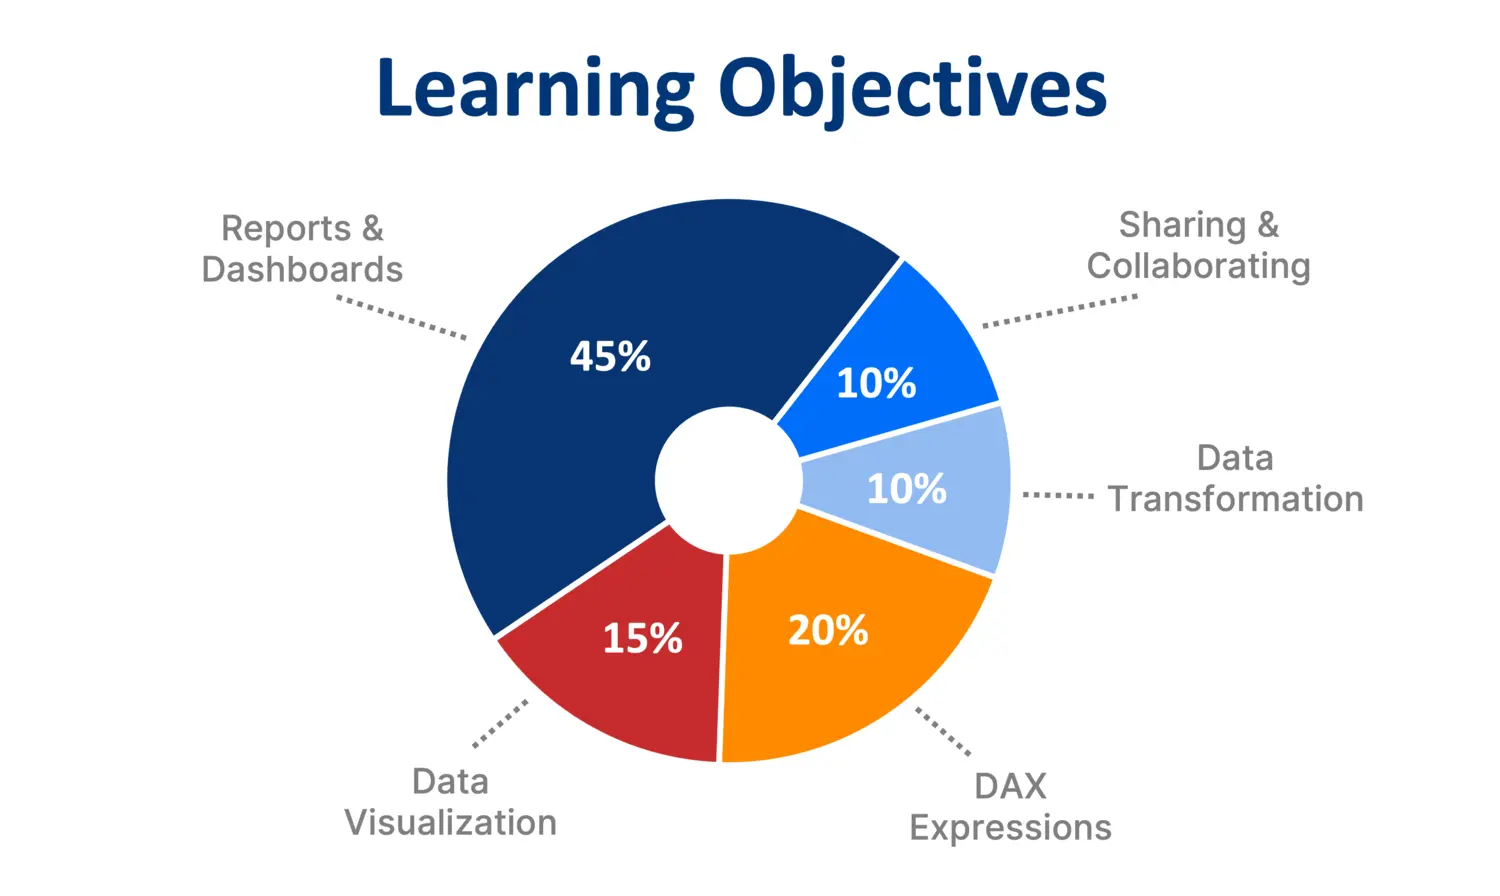
What you’ll learn
This course will teach you how to efficiently transform raw business data into beautiful and dynamic dashboards on Power BI. We’ll start with the basics, and gradually progress through more advanced modules covering Power Query transformations, data pivots, merging queries, DAX measures, calculated columns, and more. Course modules will frequently introduce practical exercises in the form of built-from-scratch reports and dashboards designed to help you visualize meaningful insights with complex data.
90+ High Quality Lessons

Downloadable Power BI, Excel, and PDF Files
Two Built-From-Scratch Sales and Finance Dashboards
Please note Power BI only works on a Windows OS
Who are these courses for?
University Students
If you're a college student looking to secure an internship or full-time job in a top tier business, finance, or investment firm, these courses are for you.
Working Professionals
If you're a working professional looking to level up your technical career skills, these courses are for you.
Career Switchers
If you're looking to boost your technical skills to better your chances of switching into a business or finance role, this course is for you.
Create stunning business reports and dashboards
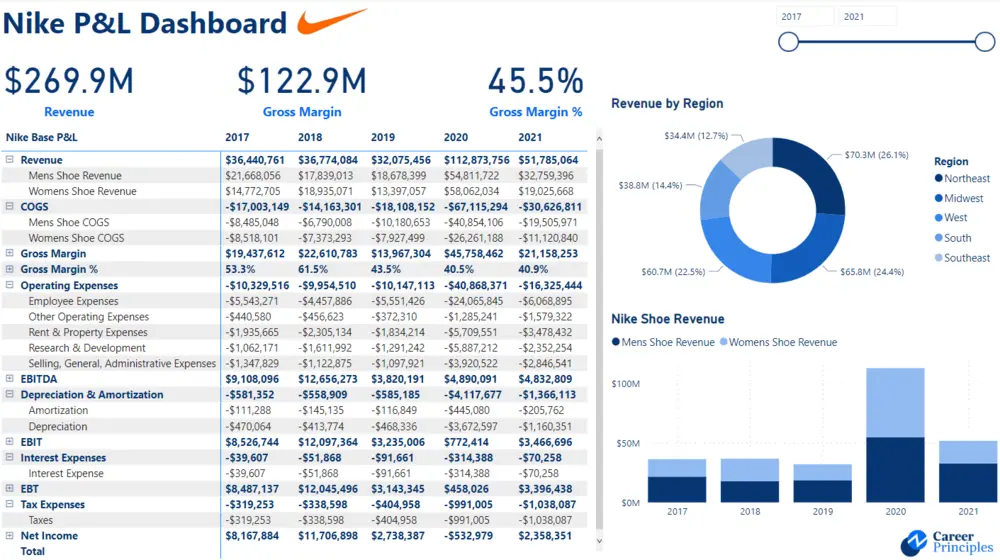
Compile dynamic charts, slicers, matrices, and other visuals to make practical data-backed reports and visuals. This includes regional sales diagrams, an interactive finance dashboard, dynamic map charts, and other key visuals applicable to core business operations analysis.

Learn to use essential data transformation tools and formulas
Write fundamental DAX formulas to create essential measures and calculated columns needed to manipulate data and automate key calculations. Students can use this course to gain practical DAX writing experience that can elevate any resume or CV.
Practical lessons designed for your business career
Our courses are specifically tailored to current or aspiring professionals in corporate business, finance, or investment-oriented roles. We’ve designed the course curriculum to match the demand from Fortune 500 companies seeking data-oriented employees with technical skillsets.
Course Curriculum
- Course Overview
- What is Power BI
- Download Power BI
- Important Power BI Settings
- Power BI Interface View Options
- Course Resources: DAX Measures Glossary
- Importing Data (SQL, Excel, Web, etc.)
- Introduction to the Power Query Editor
- Basic Transformations in Power Query
- Text Tools & Functions
- Numerical Values
- Date & Time Tools
- Grouping
- Pivot & Unpivot
- Relationships
- Merge Queries
- Append Queries
- File Path Error
- Case Study: Data Cleaning
- Report View
- Dashboard Setup
- Inserting Elements
- Creating Charts & Visuals
- Adding Forecasts & Analytics
- Creating Maps
- Conditional Formatting
- Creating Tables & Matrices
- KPI Cards
- Slicers
- Filters
- Case Study: Create a Beautiful Dashboard
- Introduction to Measures and Calculated Columns
- Data Overview and Upload
- Creating Calculated Columns
- Creating Measures
- Measure Tools: Naming & Formatting
- DAX Syntax & Other Measures
- Applying Other Measures
- Intermediate Measures
- Adding Comments & Quick Measures
- Logic Functions & Operators
- CALCULATE Function
- CALCULATE with ALL & FILTER Functions
- Related
- Iterators
- Switch
- Text Functions
- Date Functions
- Time Intelligence Functions
- Variables
- Case Study Instructions
- Data Cleaning
- Relationships
- Report Formatting
- Slicers & KPIs
- Area and Pie Charts
- Country Breakdown Table
- Map Chart
- Manager Demographics
- Grouping Age Brackets
- Case Study Conclusion
- Case Study Introduction
- Data Overview
- Cleaning and Importing Data
- Base P&L Statement Setup
- SELECTEDVALUE Function
- P&L Base Values and Subtotals
- P&L Subpercentages
- ISFILTERED & ISBLANK Function
- P&L Subcategory Line Items
- FORMAT Function
- P&L Formatting Fix
- Base Colors Setup
- Stacked Column Chart
- Regional Doughnut Chart
- KPI Cards
- Dashboard Slicer & Title
- Power BI Service - Workspaces Overview
- Publishing Desktop Power BI into Online Power BI Service
- Report View on Power BI Service
- Datasets on Power BI Service
- Dashboards on Power BI Service
- Share a Web URL Power BI Report
- Power BI Mobile Optimization
- Report Export Options (Excel, PowerPoint, PDF)
- Commenting
- Share Feature (Power BI Pro)
- Next Steps After Power BI

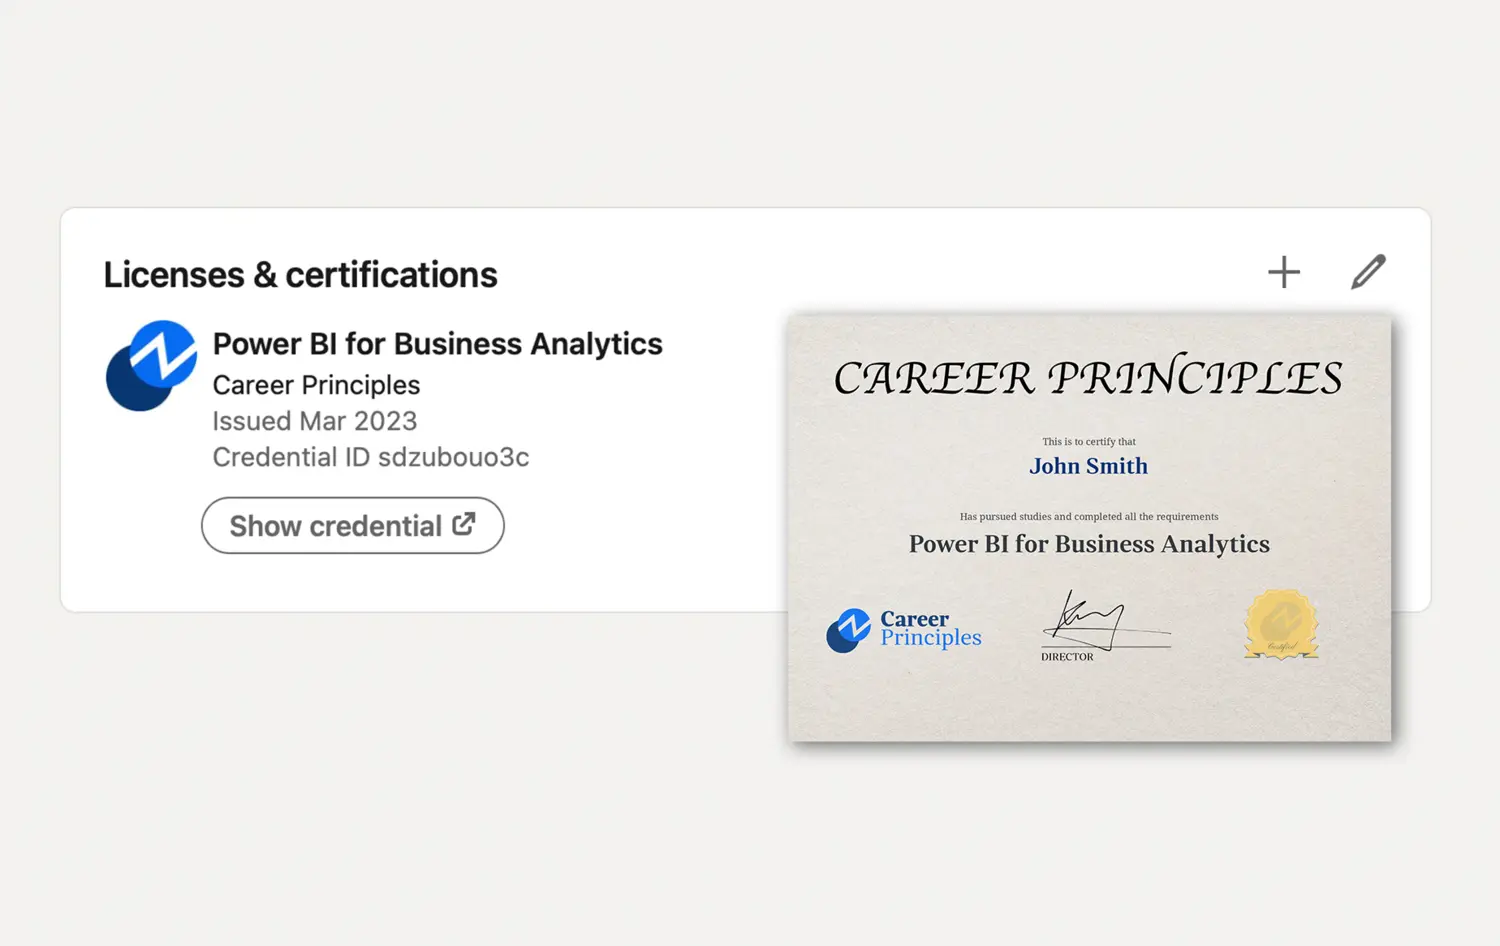
Impress recruiters with your resume
Upon completion of all course lessons, you will receive a digital certificate with your credentials. Furthermore, you can add it to your LinkedIn to show your skills to recruiters!
What our students say

Clear Explanations!
Russell Tankoua

Great job!
Marco Franceschini

Makes sense!
Ikmareka Hunt
I grow tremendously
Antonio Newman

Excellent
Bilal Kamara

Great Explanations!
Jamie Forschner

Highly Recommend!
Yakuphan Alptekin

Excellent Experience!
David Rodrigues

Wonderful Course!
Ebenezer Anane

Worth the Money!
Jamaal Tobias

Amazing Course!
Erik Reznicek

I cannot recommend their courses highly enough!
Justin Galczynski

Cheers!
Marvel Tanudjaja

Perfect!
Murilo Cangueiro

Just What I Needed!
Daniel Mwabila

Learned a lot
Hai Nguyen

Exceptional Training Solution!
Michael Penna
Engaging
Justin Risin

Awesome Course!
Andy Giro

Recommend to those in finance
Aditiya Kusuma
Great course
Tim Lorentz

Very Valuable
Robert Remondino

Super Helpful!
Isabella West

Just What I was Looking For!
Rashed Al-Romaithi

Excellent
Joseph Daher

Well Done!
Tristan Chiu
Informative
Tam Tran

The Best!
Jasmine Akujobi
Well paced
Reeta Sooknah
This course is worth it!
Selasi Kwame

Extremely Impressed
Josh McDonald

A Very Complete Course!
Teo Ballbe

Exceeded my expectations
Khin Yaminn
Keep up the good work!
Jennifer Ng
I do recommend it!
Vladimir Sobur

Very, very helpful!
Marco Horn

Very detailed
Steven Huang

I love that it's interactive
Ashley Thompson

Amazing, Detailed and Realistic!
Ishaan Mathur

Clear, concise instruction
Matt Pounch

Thank you!
Keith Aul
Beginner friendly
Julian Mascio

I like this course and recommend it
Tom Munt-Davies
Awesome learning Power BI
Jim Brooks

Great Content!
Naseef Kamal

Great stuff!
David H

Our Students Now Work At

Meet Your Instructors

Kenji Farre

Michael Quach
Learn the skills you need to advance your career
Select the course or bundle that works best for you
- {yes} Access to Full Power BI Curriculum
- {yes} Power BI Course Completion Certificate
- {yes} Power BI DAX Measures Cheat Sheet
- {yes} Downloadable Start & End Files
- {yes} Business Case Study: McDonald's Data Visualization Report
- {yes} Finance Case Study: Nike P&L Dashboard
- {no} Access to Full Excel Curriculum
- {no} Excel Course Completion Certificate
- {no} Case Study: Excel Interview Test
- {no} Case Study: Excel Interactive Dashboard
- {yes} Access to Full Power BI Curriculum
- {yes} Power BI Course Completion Certificate
- {yes} Power BI DAX Measures Cheat Sheet
- {yes} Downloadable Start & End Files
- {yes} Business Case Study: McDonald's Data Visualization Report
- {yes} Finance Case Study: Nike P&L Dashboard
- {yes} Access to Full Excel Curriculum
- {yes} Excel Course Completion Certificate
- {yes} Case Study: Excel Interview Test
- {yes} Case Study: Excel Interactive Dashboard
FAQs
Frequently Asked Questions
Unfortunately Power BI does not directly support Mac devices. However, there are some workarounds where Mac users can consider running Power BI on a virtual Windows machine or installing Windows software on a Mac via Boot Camp.
The course is designed for students to complete around 2 modules per week, for a total of 4-5 weeks until course completion. However, the course can be completed at your own pace (faster or slower) and you'll have unlimited access to the materials.
We have designed this course specifically for corporate business roles by using our internship and full-time experience at top-tier companies such as Tesla, Amazon, and Goldman Sachs. Other courses tend to fill their curriculums with theoretical and unrealistic work examples that don’t consider important real-world business factors. With this in mind, we’ve created our lessons in the course using real-life examples with our McDonald’s Sales Report and Nike P&L Finance Dashboard. We also include an interactive discussion forum to help students with additional inquiries.
Nope. You can complete the entire course using Microsoft’s FREE Power BI Desktop App. You can download the app by searching for it in your computer’s Microsoft Store or by going to https://powerbi.microsoft.com/downloads/
The course is designed for all levels of Power BI users. Whether you're a complete beginner or an experienced user, there's something to be learned for everyone!
You don’t need any prior business or technical knowledge. All you need is a computer with Excel and Power BI.
You will have lifetime access to the lessons and materials. The course can be taken on both smartphone and computer.
For any other general inquiries, please contact us at info@careerprinciples.com